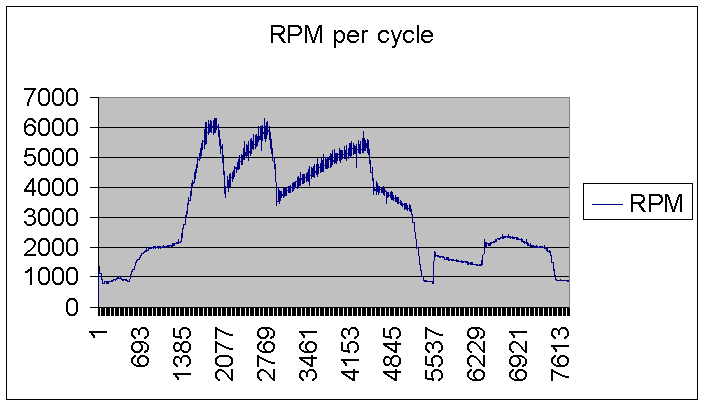
11. I can also log what the engine is doing every cycle so I can see If you have been power shifting.
I can log any variable in the program or log after so many cycles, eg vacuum advance and then feed it back to a replay program.
I used this data to test my programs to replay what is going on.
The first peak on the graph is 1st gear then 2nd and so on as you can see I started to accelerate at 2000 rpm.
The scale on the X is number of combustion cycles Y is RPM.
So 5500 rpm in 3rd how fast is that, just as well cause I live in the outback some where.
You can also see 4000 rpm in 4th gear you work it out.
Shift points can be worked out, as well in this test I was slow in changing gears.
Want to test you drive train leave pedal to the metal pop the clutch and jam a gear.
Donít worry the program has a 2 stage rev limiter on cycle by cycle rpm basis ha ha I have a carby not fuel injectors no ECM box.
But If we were to interface to it Iím sure we could improve the rev limit well we will start shutting down cylinders 250 rpm before ECM does. You will need good mufflers cause thereís fuel in them now guess what the next cycle will lite it.
Then we will increase the revstop until the ECM cuts out maybe then we could set our limit 50 Rpm below that so it never works again and you might save your drive train.
When the ECM cuts in is really messes the shift point up cause you have got no power to use.
†
Pedal to
the metal pop the clutch and jam a gear†